Creating an M3 Cluster with Kubernetes
This guide shows you how to create an M3 cluster of 3 nodes, designed to run locally on the same machine. It is designed to show you how M3 and Kubernetes can work together, but not as a production example.
This guide assumes you have read the quickstart, and builds upon the concepts in that guide.
We recommend you use our Kubernetes operator to deploy M3 to a cluster. It is a more streamlined setup that uses custom resource definitions to automatically handle operations such as managing cluster placements.
M3 Architecture
Node types
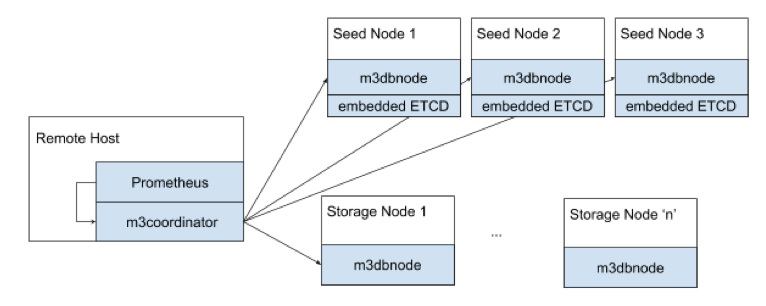
An M3 deployment typically has two main node types:
- Storage nodes (
m3dbnode) are the workhorses of M3, they store data and serve reads and writes. - Coordinator nodes (
m3coordinator) coordinate reads and writes across all nodes in the cluster. It’s a lightweight process, and does not store any data. This role typically runs alongside a Prometheus instance, or is part of a collector agent such as statsD.
A m3coordinator node exposes two external ports:
7201to manage the cluster topology, you make most API calls to this endpoint7203for Prometheus to scrape the metrics produced by M3DB and M3Coordinator
There are two other less-commonly used node types:
- Query nodes (
m3query) are an alternative query option to using M3’s built-in PromQL support. - Aggregator nodes cluster and aggregate metrics before storing them in storage nodes. Coordinator nodes can also perform this role but are not cluster-aware.
Prerequisites
M3 uses etcd as a distributed key-value storage for the following functions:
- Update cluster configuration in realtime
- Manage placements for distributed and sharded clusters
Prerequisites
- A running Kubernetes cluster.
- For local testing, you can use minikube, Docker desktop, or we have a script you can use to start a 3 node cluster with Kind.
The rest of this guide uses minikube, you may need to change some of the steps to suit your local cluster.
Create an etcd Cluster
M3 stores its cluster placements and runtime metadata in etcd and needs a running cluster to communicate with.
We have example services and stateful sets you can use, but feel free to use your own configuration and change any later instructions accordingly.
kubectl apply -f https://raw.githubusercontent.com/m3db/m3db-operator/v0.13.0/example/etcd/etcd-basic.yaml
Depending on what you use to run a cluster on your local machine, you may need to update your /etc/hosts file to match the domains specified in the etcd --initial-cluster argument. For example to match the StatefulSet declaration in the etcd-minikube.yaml above, these are etcd-0.etcd, etcd-1.etcd, and etcd-2.etcd.
Verify that the cluster is running with something like the Kubernetes dashboard, or the command below:
kubectl exec etcd-0 -- env ETCDCTL_API=3 etcdctl endpoint health
Install the Operator
Install the bundled operator manifests in the current namespace:
kubectl apply -f https://raw.githubusercontent.com/m3db/m3db-operator/v0.13.0/bundle.yaml
Create an M3 Cluster
The following creates an M3 cluster with 3 replicas of data across 256 shards that connects to the 3 available etcd endpoints.
It creates three isolated groups for nodes, each with one node instance. In a production environment you can use a variety of different options to define how nodes are spread across groups based on factors such as resource capacity, or location.
It creates namespaces in the cluster with the namespaces parameter. You can use M3-provided presets, or define your own. This example creates a namespace with the 10s:2d preset.
The cluster derives pod identity from the podIdentityConfig parameter, which in this case is the UID of the Pod.
Read more details on all the parameters in the Operator API docs.
kubectl apply -f https://raw.githubusercontent.com/m3db/m3db-operator/v0.13.0/example/m3db-local.yaml
Verify that the cluster is running with something like the Kubernetes dashboard, or the command below:
kubectl exec simple-cluster-rep2-0 -- curl -sSf localhost:9002/health
Deleting a Cluster
Delete the M3 cluster using kubectl:
kubectl delete m3dbcluster simple-cluster
By default, the operator uses finalizers to delete the placement and namespaces associated with a cluster before the custom resources. If you do not want this behavior, set keepEtcdDataOnDelete to true in the cluster configuration.
Organizing Data with Placements and Namespaces
A time series database (TSDBs) typically consist of one node (or instance) to store metrics data. This setup is simple to use but has issues with scalability over time as the quantity of metrics data written and read increases.
As a distributed TSDB, M3 helps solve this problem by spreading metrics data, and demand for that data, across multiple nodes in a cluster. M3 does this by splitting data into segments that match certain criteria (such as above a certain value) across nodes into shards.
If you’ve worked with a distributed database before, then these concepts are probably familiar to you, but M3 uses different terminology to represent some concepts.
- Every cluster has one placement that maps shards to nodes in the cluster.
- A cluster can have 0 or more namespaces that are similar conceptually to tables in other databases, and each node serves every namespace for the shards it owns.
For example, if the cluster placement states that node A owns shards 1, 2, and 3, then node A owns shards 1, 2, 3 for all configured namespaces in the cluster. Each namespace has its own configuration options, including a name and retention time for the data.
Create a Placement and Namespace
This quickstart uses the http://localhost:7201/api/v1/database/create endpoint that creates a namespace, and the placement if it doesn’t already exist based on the type argument.
You can create placements and namespaces separately if you need more control over their settings.
In another terminal, use the following command.
#!/bin/bash
curl -X POST http://localhost:7201/api/v1/database/create -d '{
  "type": "local",
  "namespaceName": "default",
  "retentionTime": "12h"
}' | jq .
{
  "namespace": {
    "registry": {
      "namespaces": {
        "default": {
          "bootstrapEnabled": true,
          "flushEnabled": true,
          "writesToCommitLog": true,
          "cleanupEnabled": true,
          "repairEnabled": false,
          "retentionOptions": {
            "retentionPeriodNanos": "43200000000000",
            "blockSizeNanos": "1800000000000",
            "bufferFutureNanos": "120000000000",
            "bufferPastNanos": "600000000000",
            "blockDataExpiry": true,
            "blockDataExpiryAfterNotAccessPeriodNanos": "300000000000",
            "futureRetentionPeriodNanos": "0"
          },
          "snapshotEnabled": true,
          "indexOptions": {
            "enabled": true,
            "blockSizeNanos": "1800000000000"
          },
          "schemaOptions": null,
          "coldWritesEnabled": false,
          "runtimeOptions": null
        }
      }
    }
  },
  "placement": {
    "placement": {
      "instances": {
        "m3db_local": {
          "id": "m3db_local",
          "isolationGroup": "local",
          "zone": "embedded",
          "weight": 1,
          "endpoint": "127.0.0.1:9000",
          "shards": [
            {
              "id": 0,
              "state": "INITIALIZING",
              "sourceId": "",
              "cutoverNanos": "0",
              "cutoffNanos": "0"
            },
            …
            {
              "id": 63,
              "state": "INITIALIZING",
              "sourceId": "",
              "cutoverNanos": "0",
              "cutoffNanos": "0"
            }
          ],
          "shardSetId": 0,
          "hostname": "localhost",
          "port": 9000,
          "metadata": {
            "debugPort": 0
          }
        }
      },
      "replicaFactor": 1,
      "numShards": 64,
      "isSharded": true,
      "cutoverTime": "0",
      "isMirrored": false,
      "maxShardSetId": 0
    },
    "version": 0
  }
}
Placement initialization can take a minute or two. Once all the shards have the AVAILABLE state, the node has finished bootstrapping, and you should see the following messages in the node console output.
{"level":"info","ts":1598367624.0117292,"msg":"bootstrap marking all shards as bootstrapped","namespace":"default","namespace":"default","numShards":64}
{"level":"info","ts":1598367624.0301404,"msg":"bootstrap index with bootstrapped index segments","namespace":"default","numIndexBlocks":0}
{"level":"info","ts":1598367624.0301914,"msg":"bootstrap success","numShards":64,"bootstrapDuration":0.049208827}
{"level":"info","ts":1598367624.03023,"msg":"bootstrapped"}
You can check on the status by calling the http://localhost:7201/api/v1/services/m3db/placement endpoint:
curl http://localhost:7201/api/v1/services/m3db/placement | jq .
{
  "placement": {
    "instances": {
      "m3db_local": {
        "id": "m3db_local",
        "isolationGroup": "local",
        "zone": "embedded",
        "weight": 1,
        "endpoint": "127.0.0.1:9000",
        "shards": [
          {
            "id": 0,
            "state": "AVAILABLE",
            "sourceId": "",
            "cutoverNanos": "0",
            "cutoffNanos": "0"
          },
          …
          {
            "id": 63,
            "state": "AVAILABLE",
            "sourceId": "",
            "cutoverNanos": "0",
            "cutoffNanos": "0"
          }
        ],
        "shardSetId": 0,
        "hostname": "localhost",
        "port": 9000,
        "metadata": {
          "debugPort": 0
        }
      }
    },
    "replicaFactor": 1,
    "numShards": 64,
    "isSharded": true,
    "cutoverTime": "0",
    "isMirrored": false,
    "maxShardSetId": 0
  },
  "version": 2
}
Ready a Namespace
Once a namespace has finished bootstrapping, you must mark it as ready before receiving traffic by using the http://localhost:7201/api/v1/services/m3db/namespace/ready.
#!/bin/bash
curl -X POST http://localhost:7201/api/v1/services/m3db/namespace/ready -d '{
  "name": "default"
}' | jq .
{
"ready": true
}
View Details of a Namespace
You can also view the attributes of all namespaces by calling the http://localhost:7201/api/v1/services/m3db/namespace endpoint
curl http://localhost:7201/api/v1/services/m3db/namespace | jq .
Add ?debug=1 to the request to convert nano units in the output into standard units.
{
  "registry": {
    "namespaces": {
      "default": {
        "bootstrapEnabled": true,
        "flushEnabled": true,
        "writesToCommitLog": true,
        "cleanupEnabled": true,
        "repairEnabled": false,
        "retentionOptions": {
          "retentionPeriodNanos": "43200000000000",
          "blockSizeNanos": "1800000000000",
          "bufferFutureNanos": "120000000000",
          "bufferPastNanos": "600000000000",
          "blockDataExpiry": true,
          "blockDataExpiryAfterNotAccessPeriodNanos": "300000000000",
          "futureRetentionPeriodNanos": "0"
        },
        "snapshotEnabled": true,
        "indexOptions": {
          "enabled": true,
          "blockSizeNanos": "1800000000000"
        },
        "schemaOptions": null,
        "coldWritesEnabled": false,
        "runtimeOptions": null
      }
    }
  }
}
Replication factor
We recommend a replication factor of 3, with each replica spread across failure domains such as a physical server rack, data center or availability zone. Read our replication factor recommendations for more details.
Shards
Read the placement configuration guide to determine the appropriate number of shards to specify.
Writing and Querying Metrics
Writing Metrics
M3 supports ingesting statsd and Prometheus formatted metrics.
This quickstart focuses on Prometheus metrics which consist of a value, a timestamp, and tags to bring context and meaning to the metric.
You can write metrics using one of two endpoints:
- http://localhost:7201/api/v1/prom/remote/write - Write a Prometheus remote write query to M3DB with a binary snappy compressed Prometheus WriteRequest protobuf message.
- http://localhost:7201/api/v1/json/write - Write a JSON payload of metrics data. This endpoint is quick for testing purposes but is not as performant for production usage.
For this quickstart, use the http://localhost:7201/api/v1/json/write endpoint to write a tagged metric to M3 with the following data in the request body, all fields are required:
tags: An object of at least onename/valuepairstimestamp: The UNIX timestamp for the datavalue: The value for the data, can be of any type
The examples below use __name__ as the name for one of the tags, which is a Prometheus reserved tag that allows you to query metrics using the value of the tag to filter results.
Label names may contain ASCII letters, numbers, underscores, and Unicode characters. They must match the regex [a-zA-Z_][a-zA-Z0-9_]*. Label names beginning with __ are reserved for internal use. Read more in the Prometheus documentation.
#!/bin/bash
curl -X POST http://localhost:7201/api/v1/json/write -d '{
  "tags":
    {
      "__name__": "third_avenue",
      "city": "new_york",
      "checkout": "1"
    },
    "timestamp": '\"$(date "+%s")\"',
    "value": 3347.26
}'
#!/bin/bash
curl -X POST http://localhost:7201/api/v1/json/write -d '{
  "tags":
    {
      "__name__": "third_avenue",
      "city": "new_york",
      "checkout": "1"
    },
    "timestamp": '\"$(date "+%s")\"',
    "value": 5347.26
}'
#!/bin/bash
curl -X POST http://localhost:7201/api/v1/json/write -d '{
  "tags":
    {
      "__name__": "third_avenue",
      "city": "new_york",
      "checkout": "1"
    },
    "timestamp": '\"$(date "+%s")\"',
    "value": 7347.26
}'
Querying metrics
M3 supports three query engines: Prometheus (default), Graphite, and the M3 Query Engine.
This quickstart uses Prometheus as the query engine, and you have access to all the features of PromQL queries.
To query metrics, use the http://localhost:7201/api/v1/query_range endpoint with the following data in the request body, all fields are required:
query: A PromQL querystart: Timestamp inRFC3339Nanoof start range for resultsend: Timestamp inRFC3339Nanoof end range for resultsstep: A duration or float of the query resolution, the interval between results in the timespan betweenstartandend.
Below are some examples using the metrics written above.
Return results in past 45 seconds
curl -X "POST" -G "http://localhost:7201/api/v1/query_range" \
  -d "query=third_avenue" \
  -d "start=$(date "+%s" -d "45 seconds ago")" \
  -d "end=$( date +%s )" \
  -d "step=5s" | jq .
curl -X "POST" -G "http://localhost:7201/api/v1/query_range" \
  -d "query=third_avenue" \
  -d "start=$( date -v -45S +%s )" \
  -d "end=$( date +%s )" \
  -d "step=5s" | jq .
{
  "status": "success",
  "data": {
    "resultType": "matrix",
    "result": [
      {
        "metric": {
          "__name__": "third_avenue",
          "checkout": "1",
          "city": "new_york"
        },
        "values": [
          [
            1770396010,
            "3347.26"
          ],
          [
            1770396010,
            "5347.26"
          ],
          [
            1770396010,
            "7347.26"
          ]
        ]
      }
    ]
  }
}
Values above a certain number
curl -X "POST" -G "http://localhost:7201/api/v1/query_range" \
  -d "query=third_avenue > 6000" \
  -d "start=$(date "+%s" -d "45 seconds ago")" \
  -d "end=$( date +%s )" \
  -d "step=5s" | jq .
curl -X "POST" -G "http://localhost:7201/api/v1/query_range" \
  -d "query=third_avenue > 6000" \
  -d "start=$(date -v -45S "+%s")" \
  -d "end=$( date +%s )" \
  -d "step=5s" | jq .
{
  "status": "success",
  "data": {
    "resultType": "matrix",
    "result": [
      {
        "metric": {
          "__name__": "third_avenue",
          "checkout": "1",
          "city": "new_york"
        },
        "values": [
          [
            1770396010,
            "7347.26"
          ]
        ]
      }
    ]
  }
}